There are a few options for viewing LoRa APRS stations on the web in a map-based display. Of course, one could just go to https://aprs.fi/ and set some filters by station type, destination callsign, etc. The most comprehensive “ready to go” LoRa APRS map viewer appears to be https://lora.ham-radio-op.net/ which is run by EA2RCF. I assume that this feed comes from filtering APRS-IS data as mentioned, but the filter settings are unclear to me.
Recently I was made aware of https://lora-aprs.live/ which is a new(?) logging server for LoRa APRS traffic. My friend Gary WB5PJB let me know about this service, and suggested that I add it to the syslog of my LoRa APRS i-gates. I’ve added it to my home and portable i-gates (W0RMT-40, W0RMT-42) but still need to update the i-gate in my Denver office (W0RMT-41). The site offers some very cool analysis features and I would encourage anyone experimenting with LoRa APRS to feed their data to this system.
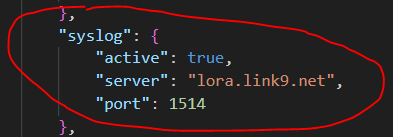
Configuration of your i-gate is very straightforward. Here are the settings for the igate_conf.json file. Note that this information can also be entered in the web configuration form if you use that method.
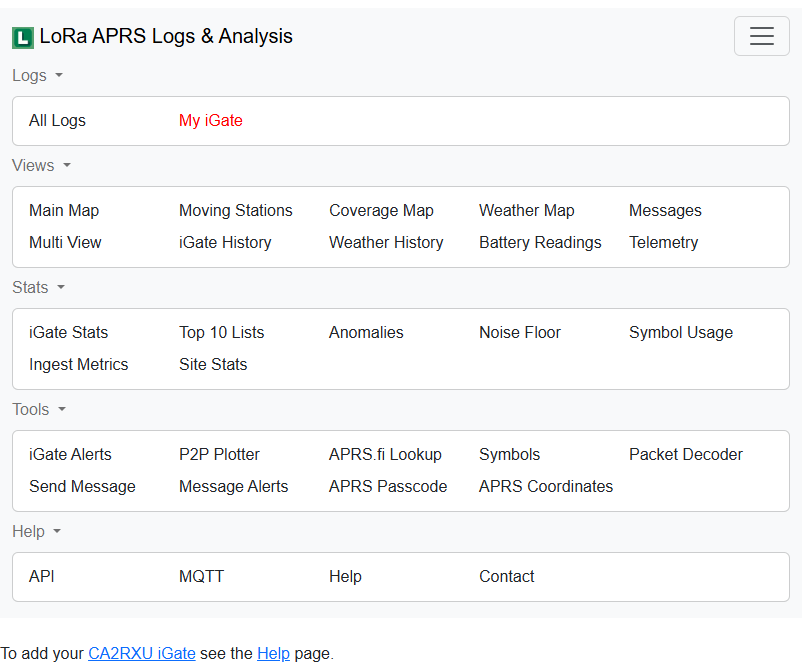
The lora-aprs.live site has some very cool features, and it is worth poking around in there even if you are not feeding it data. There are analysis tools for both i-gates and trackers.
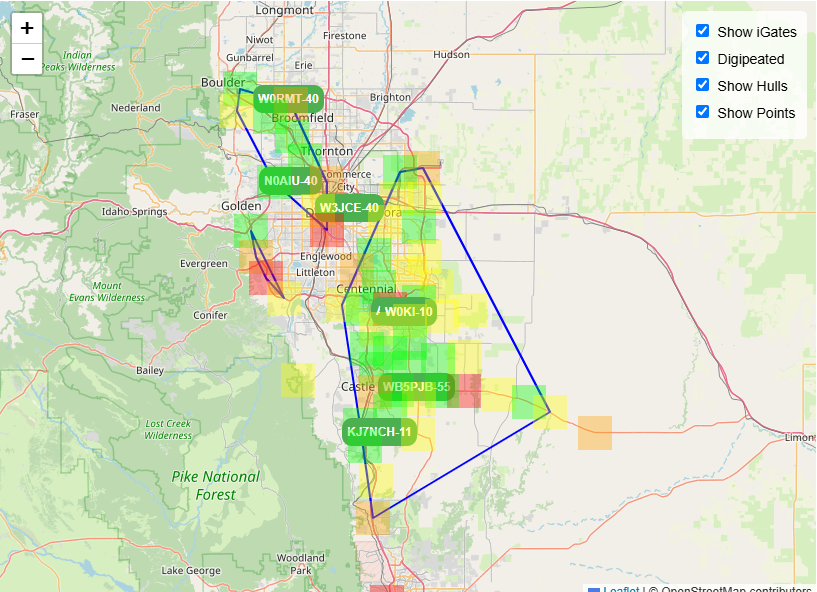
One very cool features is the i-gate coverage map. Note that not all of our Denver metro area i-gates are feeding this system yet, so coverage is better than indicated in this view. Compare this map view to that above from https://lora.ham-radio-op.net/ and you will see that not all stations are feeding lora-aprs.live.
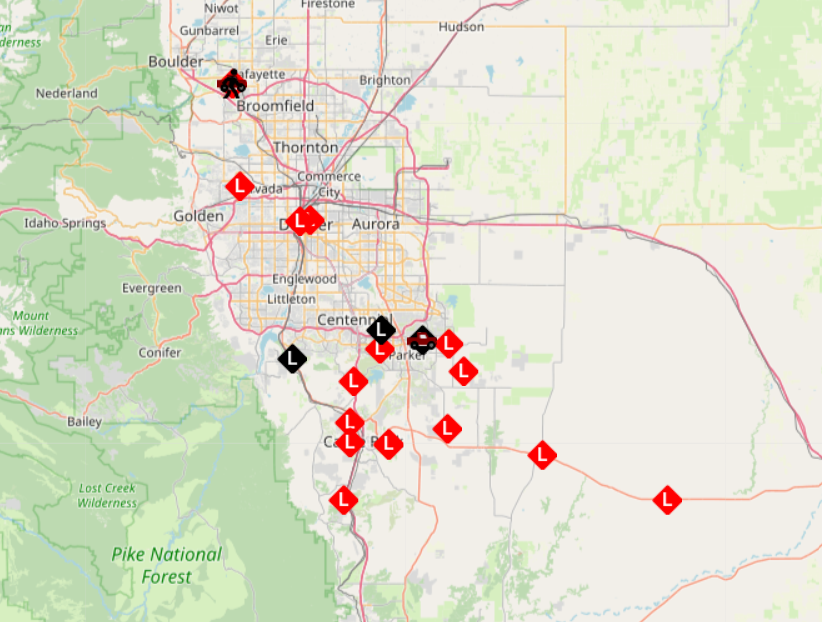
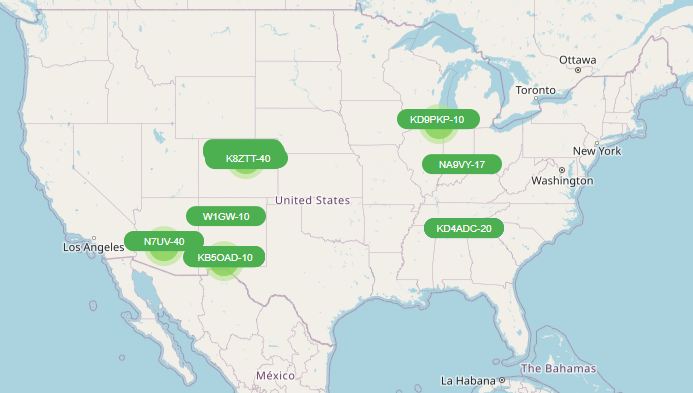
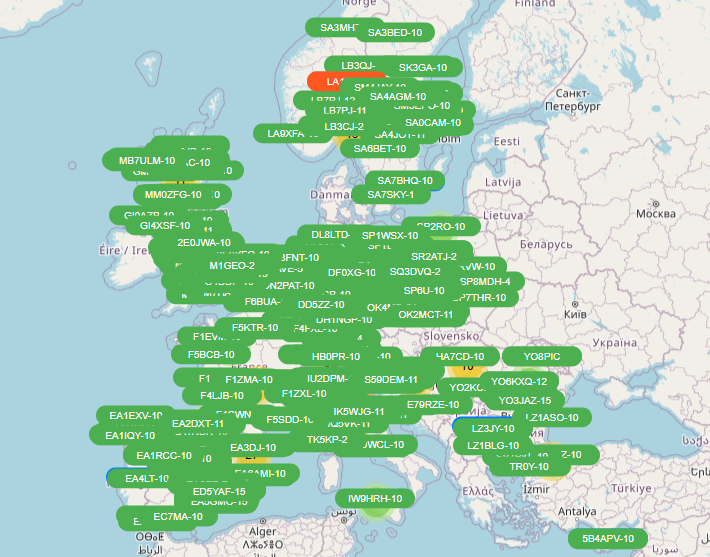
It is also very nice to be able to see, in a quick overview, what LoRa APRS activity in the USA and throughout the world is feeding logs to LoRa APRS live. In the USA, the hotspots of activity seem to be the Denver/Front Range metro area, Chicago, Las Cruces, and Phoenix. There is much more LoRa APRS activity in Europe that is feeding this system.
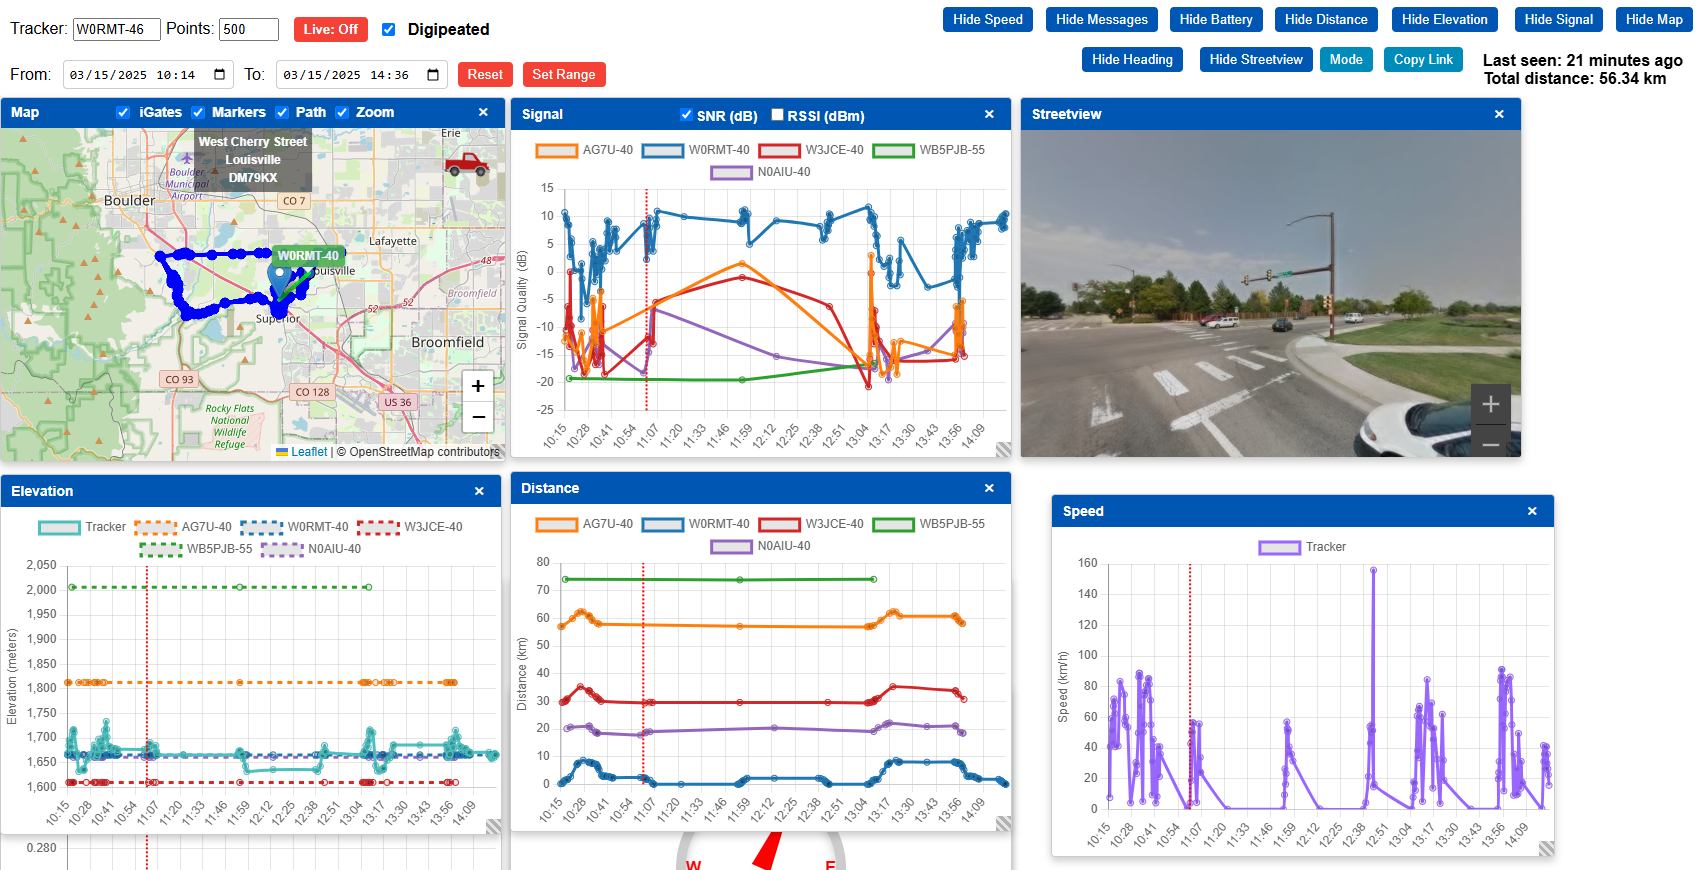
Another very nice feature of lora-aprs.live is the “Multi View.” On this page, you can see data for any LoRa APRS tracker that is hitting i-gates which feed the system, which i-gates it is hitting, i-date distance from tracker, i-gate elevation, SNR, tracker speed and lcoation, and a Google street view of tracker location. The tiles are moveable, and you can even view this page in dark mode! Very nice.
I’ve still got a lot more to explore and learn about LoRa APRS Live logging, but it is becoming a great tool as we continue to build out and use our LoRa APRS network in Colorado. I hope more LoRa APRS users start feeding into this system.
Leave a Reply
You must be logged in to post a comment.